
As a seasoned IT and Operations consultant in the charter school space, I specialize in helping organizations unlock the power of their data. One of the tools I frequently work with is PowerSchool, a powerful student information system used by many K-12 schools. My expertise lies in helping schools efficiently extract, analyze, and visualize data from PowerSchool, allowing them to make data-driven decisions in near-real time.
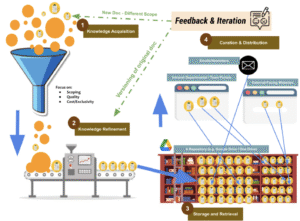
Here’s how I approach helping schools integrate PowerSchool with their data systems for faster, actionable insights:
1. Determining the Scope of Data Needs
The first step is always to understand the unique needs of my clients. I work closely with school leaders and data teams to determine exactly which data should be analyzed and visualized. Whether it’s enrollment data, attendance, or performance metrics, defining the scope ensures that the solution is tailored to the school’s specific goals.
2. Customizing a PowerSchool Plugin for Data Extraction
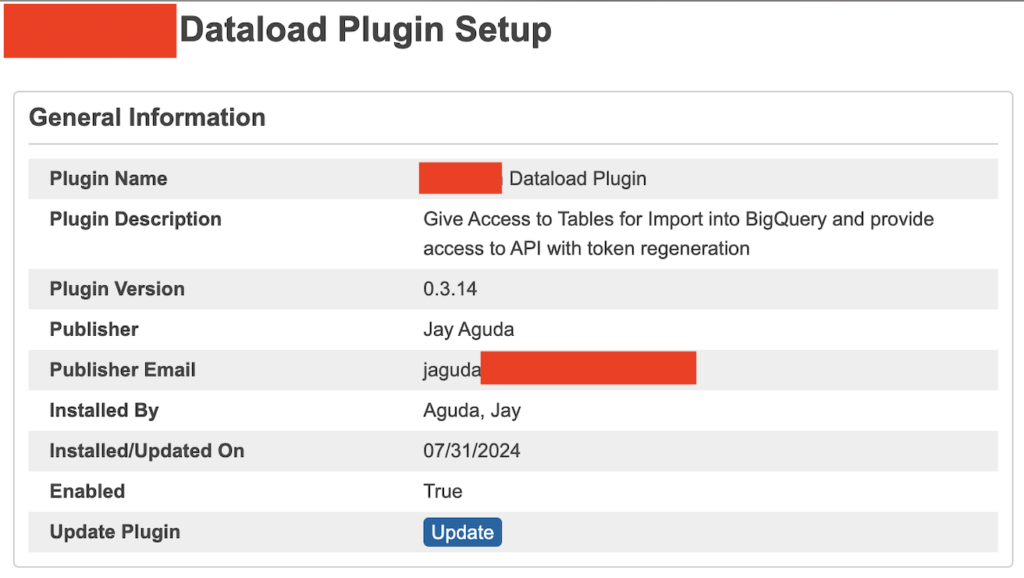
Once we know what data is needed, I build a customized PowerSchool plugin to pull this information and share it with a service runner. Using Google Cloud Platform (GCP), I develop Cloud Run Functions to automate the extraction process, ensuring the data is regularly updated. These functions can run at intervals that best suit the client’s needs – whether that’s hourly, daily, or weekly.
For clients without an existing data warehouse, I set up Google Cloud BigQuery to store and process the data. BigQuery is highly recommended for its speed and efficiency in handling large datasets. It’s also a great fit for integration with visualization tools like Looker Studio, which makes it even easier to access insights.
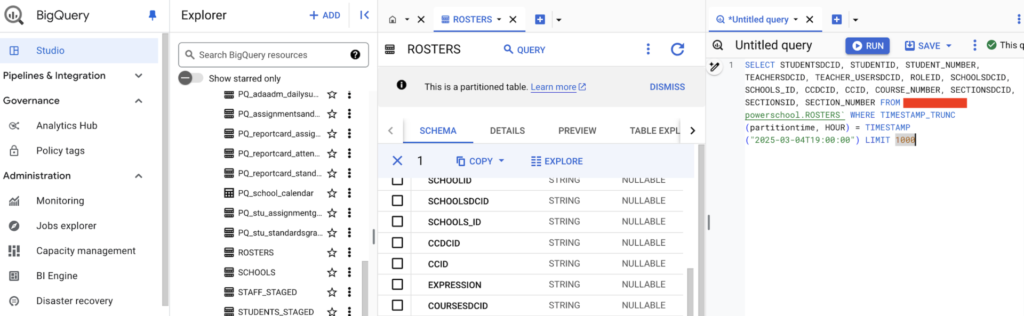
3. Staging Data for Visualization
After data extraction, I create custom views of the staged data in the warehouse. This process ensures the data is formatted and structured for easy import into Google Sheets or other tools for quick analysis. By staging the data, we can ensure that it’s ready for immediate visualization without complex data wrangling.
4. Building Dashboards and Data Visualizations
For clients without an in-house data visualization team, I offer additional support by developing custom dashboards using Looker Studio and Tableau. These tools allow school leaders to see up-to-date insights at a glance, from student performance trends to enrollment projections. Dashboards are designed to be interactive and user-friendly, so decision-makers can easily drill down into the data that matters most to them.
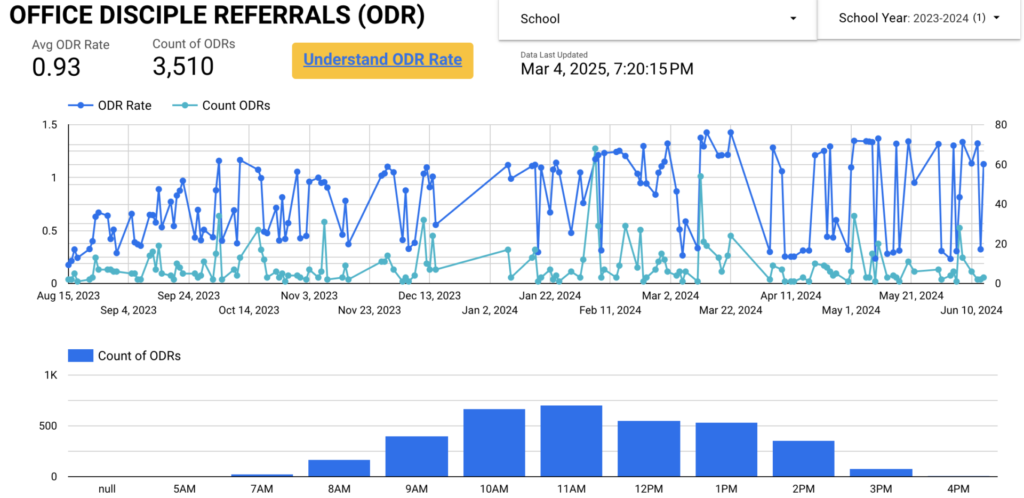
With my approach, schools can quickly harness the power of their PowerSchool data for real-time decision-making. Whether you need a custom plugin, a data warehouse solution, or help building interactive dashboards, I’m here to help charter schools visualize their data efficiently and effectively. Let me help you unlock the full potential of your data and drive smarter decision-making across your organization.