
In the world of IT and operations, variation isn’t just a theory—it’s a reality. From traffic patterns in Los Angeles to service level agreements in an IT department, variation in systems is a fact of life. Understanding and managing this variation is essential for ensuring smooth operations, whether you’re dealing with daily commutes or technical processes.
Variation in Daily Life: The LA Commute
Let’s use a real-world example to illustrate how system variation works. Imagine you’re driving from Chatworth to Downtown Los Angeles—a distance of 31.5 miles. In an ideal world, traveling 60 miles per hour would mean the drive would take around 31.5 minutes. However, traffic in LA is far from predictable. By tracking your drive times using Google Maps or a similar tool, you’ll quickly discover that your commute time varies significantly throughout the day.
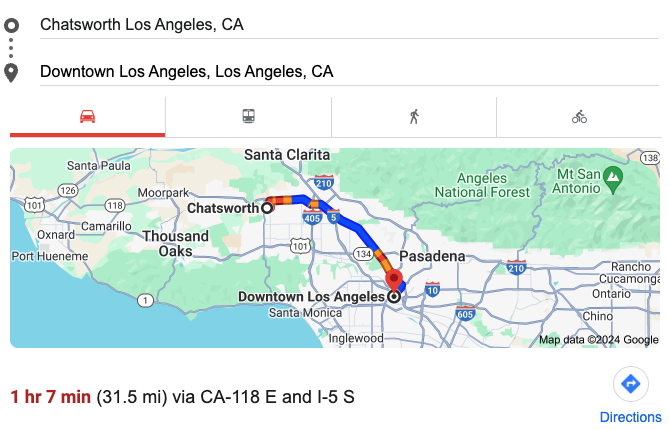
This difference in travel time is caused by variation in traffic patterns, accidents, and other factors. On average, you might find that your commute takes around 40 minutes. But the average alone doesn’t tell the whole story—standard deviation (a key concept in understanding variation) helps you predict how much longer or shorter your commute might be on any given day. Understanding and planning for these fluctuations is crucial, just as it is when managing any system in IT or operations.
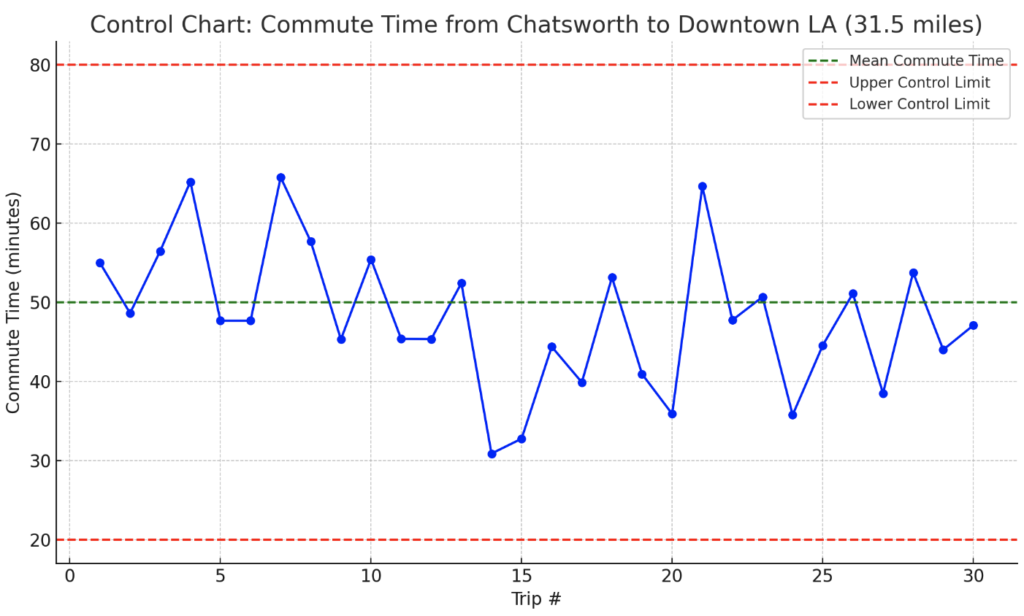
Control Chart of Commute Time from Chatsworth to Downtown LA – This chart visualizes the variability in commute times over 30 trips (31.5 miles), with the mean commute time (green line) and upper/lower control limits (red lines) representing three standard deviations above and below the mean. The fluctuation in commute times illustrates the concept of variation in systems, emphasizing the importance of understanding and managing variability in processes, just like IT operations.
Stable vs. Unstable Systems: What’s the Difference?
Systems can be classified as either stable or unstable. A stable system shows predictable, manageable variation, while an unstable system demonstrates wide, erratic swings in performance. In IT and operations, stable systems are typically easier to manage because the range of fluctuation is smaller. However, even unstable systems can be improved by understanding and managing their variation.
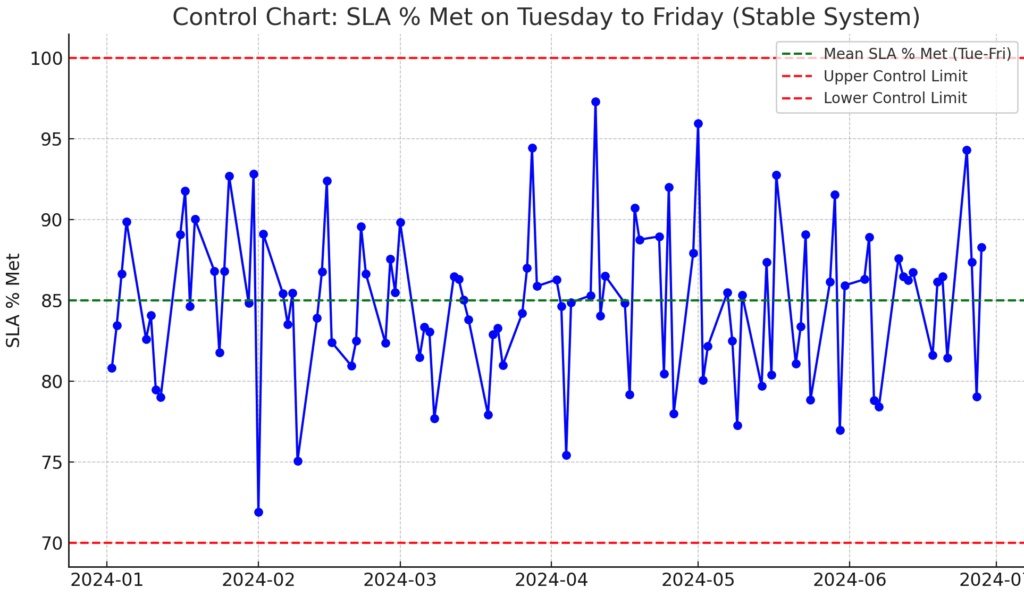
Control Chart: SLA % Met on Tuesday to Friday (Stable System) – This chart shows the SLA performance for the rest of the week (Tuesday to Friday), with a higher average SLA % of 85% and much lower variation. The smaller swings between control limits reflect a more controlled and stable system.
For example, in my role managing IT operations, I encountered significant SLA (service level agreement) variation. Prior to an intervention, my team’s SLA performance on Mondays was highly inconsistent—averaging 72% SLA % met, with a standard deviation of 20%. We found that technicians were holding off ticket resolutions over the weekend, resulting in a rush of work on Mondays, leading to unpredictable performance.
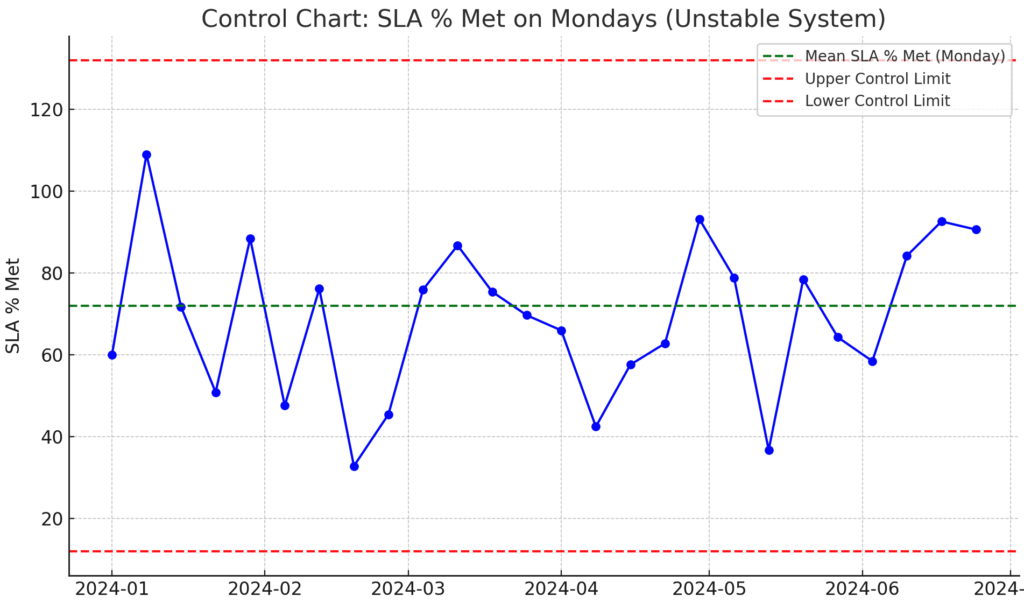
Control Chart: SLA % Met on Mondays (Unstable System) – This chart illustrates the high variability in SLA performance on Mondays, with a mean SLA % of 72% and a large standard deviation, leading to wide swings in performance. The control limits show how this variation results in an unstable system
Managing System Variation with PDSA (Plan-Do-Study-Act)
To address this variation, we applied PDSA (Plan-Do-Study-Act)—a powerful tool for improving processes and managing system performance. Here’s how we tackled the issue:
1. Plan:
We started by identifying the problem through root cause analysis. The issue? A pattern of ticket deferrals over the weekend that caused our SLA performance to fluctuate drastically on Mondays.
2. Do:
We didn’t jump to conclusions—we let the system continue running and pulled six months of data from our ticketing system. This provided us with enough information to make informed decisions.
3. Study:
Once we had the data, we analyzed it. Were we satisfied with the average SLA performance and the degree of variation? No. The high variation was unacceptable, as it impacted our ability to focus on larger projects requiring more strategic thinking and resources.
4. Act:
We implemented a solution. By examining the data, we discovered that the most problematic tickets were simple issues that could easily be addressed through self-service options like video tutorials or a support portal. We shifted lower-tier tickets to a self-help system, freeing up technicians to focus on more complex tasks.
With this intervention in place, we ran the system again, collected more data, and studied the results to determine if the variation decreased. If further adjustments were necessary, we repeated the PDSA cycle.
Conclusion: Understanding Variation for Better Process Control
Variation in systems is unavoidable, whether you’re dealing with traffic in LA or managing a complex IT department. The key is to understand that variation exists and use structured approaches like PDSA to control it. Stable systems, with their more predictable outputs, are easier to manage, but even unstable systems can be improved with the right data and strategies. By managing variation effectively, you can increase efficiency, improve performance, and achieve more consistent outcomes in any field.